Some types of graphs are not JS compatible

Discussion about generation of graphs and tables
Post Reply
netsigi
Posts: 4
Joined: Thu Dec 24, 2015 12:59 pm

Some types of graphs are not JS compatible

Post by netsigi » Mon Dec 28, 2015 12:46 pm

Hi, if i try engine=JS for "Wind Radar" the graph is not really usable.

Code: Select all

    #engine=js
    timeframe=6h              # set total time frame to previous month
    dirlist=N,NNO,NO,ONO,O,OSO,SO,SSO,S,SSW,SW,WSW,W,WNW,NW,NNW

    gtitle=Hauptwindrichtung_letzte_6_Stunden  # name of graph
    gheight=400                 # height in pixels of graph
    gwidth=400                  # width in pixels of graph
    glunit=_%                   # show percent as unit on axis and balloons
    gtype=radar%                # radar graph shows directional distribution in percent
    res=minute15

    sid0=wind4 sfill0=20 sname0=main_wind_dir ssel0=maindir sprec0=0
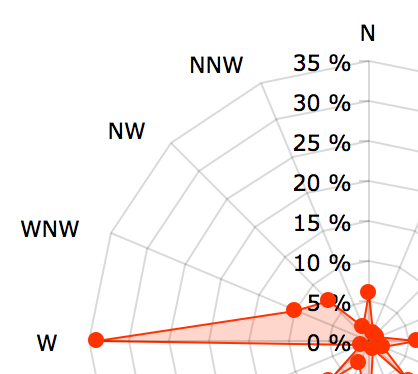
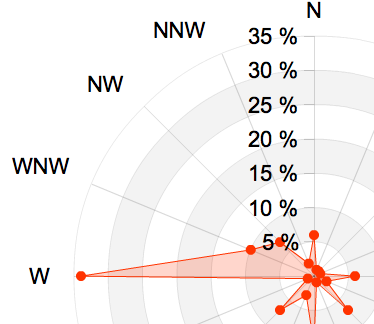
bad:
Bad
Bad
Bildschirmfoto 2015-12-24 um 00.46.27.png (25.73 KiB) Viewed 18270 times
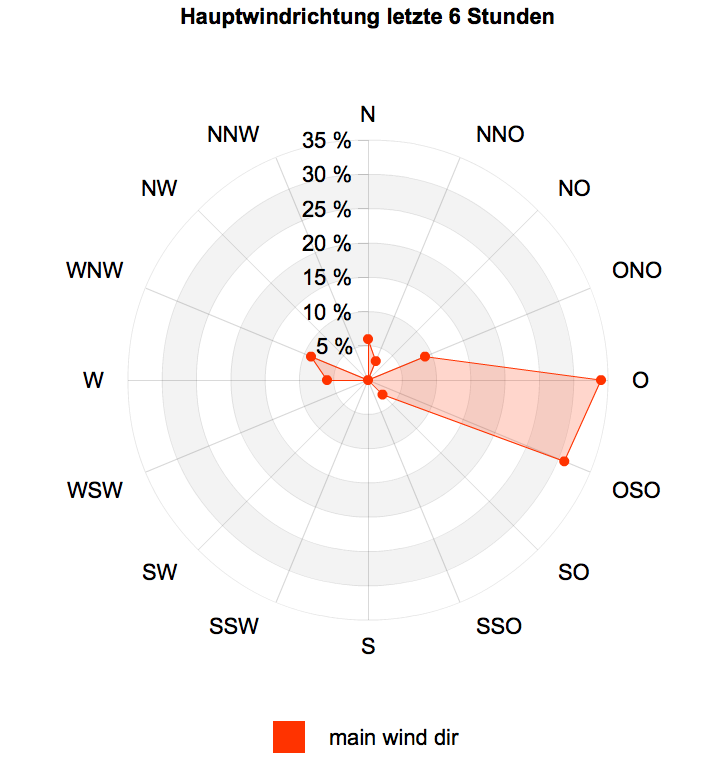
good, but Flashy:
good
good
Bildschirmfoto 2015-12-24 um 00.46.05.png (102.27 KiB) Viewed 18270 times

ironedge
Posts: 56
Joined: Tue Sep 23, 2014 9:32 am
Contact:

Re: Some types of graphs are not JS compatible

Post by ironedge » Mon Jan 04, 2016 9:17 pm

Not sure what goes wrong on your side. I do use Wind Radar graphs with JavaScript engine and it works fine. Maybe you need to explicitly set colors.

Here my definition:

Code: Select all

timeframe=-1M               # set total time frame to previous month
dirlist=N,NNO,NO,ONO,O,OSO,SO,SSO,S,SSW,SW,WSW,W,WNW,NW,NNW
engine=JavaScript
bgcolor=#FFFFFF
textcolor=#000000
gridcolor=#000000
gtitle=Haupt-Windrichtung  # name of graph
gheight=500                 # height in pixels of graph
gwidth=600                  # width in pixels of graph
glunit=_%                   # show percent as unit on axis and balloons
gtype=radar%                # radar graph shows directional distribution in percent
res=min30 
sid0=wind0 sfill0=20 sname0=Haupt-Windrichtung ssel0=maindir sprec0=0
Feel free to check on my website at http://wetter.isenegger.org/alle-wetterdaten/ (select "Windrichtung"). It's a JavaScript graph like all other graphs on my website, and for that it also works perfectly fine on mobile devices without Flash.

Brodin
Posts: 1
Joined: Thu Jan 07, 2016 10:50 pm

Re: Some types of graphs are not JS compatible

Post by Brodin » Fri Jan 08, 2016 3:58 pm

thanks dude. I'll learn to that

netsigi
Posts: 4
Joined: Thu Dec 24, 2015 12:59 pm

Re: Some types of graphs are not JS compatible

Post by netsigi » Sat Jan 09, 2016 4:36 pm

Thanks a lot...

much better now. At least some output. I wish some day the details will be optically better.
Java
Java
js.png (51.29 KiB) Viewed 18249 times
The attachment js.png is no longer available
Attachments
flash
flash
flash.png (43.97 KiB) Viewed 18249 times

Post Reply