Min/Max marker in charts
Posted: Sat May 05, 2012 9:35 am
For javascript line charts there is a new option that allows to put markers in the chart where minimum or maximum values did happen.
Simply add "sminmarker" or "smaxmarker" to the sensor description like in the example below. The stars are displayed in the color of the corresponding line and when the cursor does touch them a balloon pops up, that shows the marker text you did specify followed by value and unit.
Result:
Simply add "sminmarker" or "smaxmarker" to the sensor description like in the example below. The stars are displayed in the color of the corresponding line and when the cursor does touch them a balloon pops up, that shows the marker text you did specify followed by value and unit.
Code: Select all
timeframe=3D    # set total time frame to 3 days before today until today
zoom=1D            # select actual day
engine=js
gtitle=Temp/Hum    # name of graph
gheight=400       # height in pixels of graph
gwidth=550         # width in pixels of graph
glunit=°C            # unit of left y-axis
grunit=%            # unit of right y-axis
gtype=line          # type of graph
gtrim=0

sid0=th0 sname0=temp ssel0=temp sminmarker0=MIN smaxmarker0=MAX      # sensor 0, temperature
sid1=th0 sname1=dew ssel1=dew sminmarker1=MIN smaxmarker1=MAX        # sensor 1, dew point
sid2=th0 syaxis2=r  sname2=hum ssel2=hum sminmarker2=MIN smaxmarker2=MAX  # sensor 2, humidity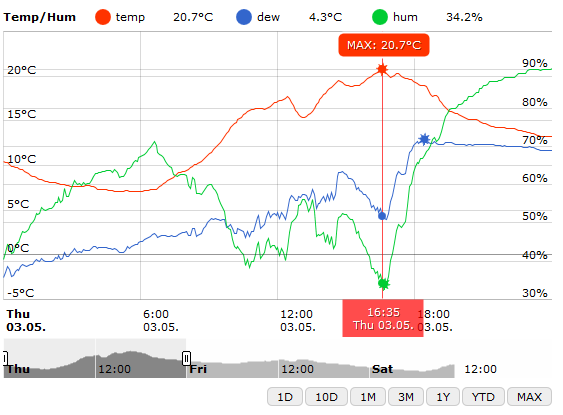
- am11.png (32.8 KiB) Viewed 5427 times