Changing values shown on axis
Posted: Thu Oct 13, 2011 2:54 pm
Hi,
With MeteoHub I uso this format command on graphs:
And I get the small jpg graphs I've on my homepage at http://www.meteoqueixans.com.
But using MeteoPlug I don't know how to use these same commands. I use this:
It seams to work a bit but not for all the commands. See attached image:
Anyone can help?
Regards
With MeteoHub I uso this format command on graphs:
Code: Select all
set locale "es_ES"; set title offset 0,-1;set format x "%d-%m";set lmargin 5;set format y "%.1f";But using MeteoPlug I don't know how to use these same commands. I use this:
Code: Select all
ggpformat=set_locale_"es__ES";_set_title_offset_0,-1;set_format_x_"%Hh";set_lmargin_5;set_format_y_"%.1f";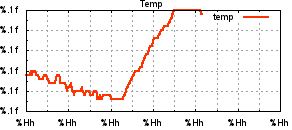
- Captura.JPG (18.8 KiB) Viewed 3524 times
Regards