I am having problems getting a graph to work. I want to show Gas use from my gas meter sensor and outdoor temperature.
I use the following definition.
timeframe=365D #last 365 days
res=DAY1 #SHOWS WHOLE DAY DATA
zoom=1M # select actual day
gtitle=Gas_Use_Daily # name of graph
gheight=600 # height in pixels of graph
gwidth=900 # width in pixels of graph
glunit=kWh # unit of left y-axis
grunit=°C # unit of right y-axis
gtype=line # type of graph
gtrim=0
sid0=data2 sname0=Total ssel0=suminc sfill0=20 sfactor0=0.00121 scolor0=FF0000
sid1=th0 sname1=Temp°C ssel1=temp scolor1=0000FF # sensor 0, temperature
I can't get the units to show on the right of the y axis and also the temperature is showing as kWh not °C on the top of the graph.
I have tried setting grunit on other graphs with no problem at all.
Graphing problem
Graphing problem
- Attachments
-
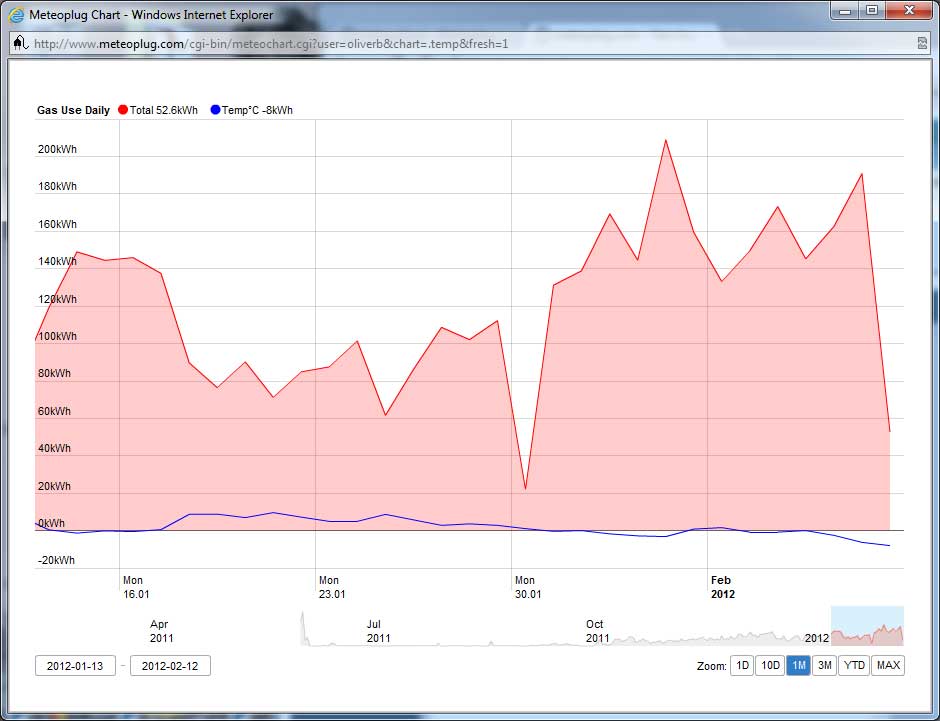
- gas_temp.jpg (51.42 KiB) Viewed 5245 times

Re: Graphing problem
There is a statement missing for sensor #1, that it should plot against right y-axis. Please add: "syaxis1=r"
Re: Graphing problem
Thanks for that.
Re: Graphing problem
I was also having the same issue. It's good that I read about this topic here & was able to resolved it, awesome!
Read my review about Digital SLRs at http://www.buydigitalcamera.us