
Is it possible to display the wind in bft?
https://www.meteoplug.com/cgi-bin/meteo ... 4b0b050f08
wind in bft

Re: wind in bft
Meteoplug allows to compute linear functions on the basic values. So you can make mp/h or km/h out of the m/s. As Bft cannot be computed by a linear function from m/s it is not possible at the moment to have graphs with Bft as y-axis.
Re: wind in bft
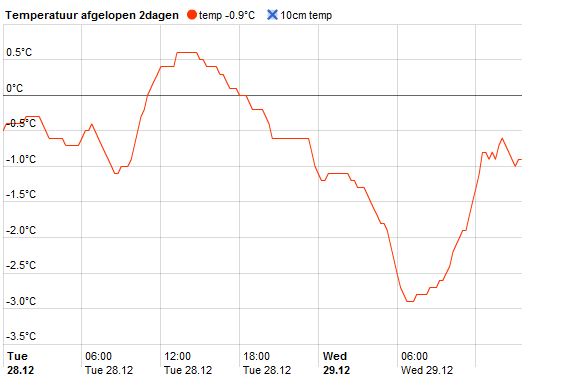
* Is it possible to switch the blue button default off without removing this line. (sid1=t0 sname1=10cm_temp ssel1=temp # sensor, 10cm temp)
* translation in dutch? (not WED but Woensdag)
* extra textfield for comments under the graphic. (sample comment: the color buttons are clickable)
* translation in dutch? (not WED but Woensdag)
* extra textfield for comments under the graphic. (sample comment: the color buttons are clickable)
- Attachments
-
- uit.JPG (33.56 KiB) Viewed 4686 times
Re: wind in bft
ad 1: I did not find a feature in underlying amcharts that allows to have a defined line deselected from the beginning onaeng wrote:* Is it possible to switch the blue button default off without removing this line. (sid1=t0 sname1=10cm_temp ssel1=temp # sensor, 10cm temp)
* translation in dutch? (not WED but Woensdag)
* extra textfield for comments under the graphic. (sample comment: the color buttons are clickable)
ad 2: "daylist" option should handle that. Details can be found here: http://wiki.meteoplug.com/Define_Chart#Chart_Settings
ad 3: not implemented, but HTML in which the iframe is embedded could present some text below the graph.