I'm using Meteobridge to upload to Meteoplug Cloud. I am using "__dashboard-1" as my default chart.
1. How do I display the charts in Imperial? I've set "Units" in the Instruments menu as Imperial values, but charts still display in metric. I've looked in the Define Chart menu, but all 3 "__dashboard..." templates show template=http://www.meteoplug.com/dashboardxx.html, with nothing apparently customizable as the dozens of other charts are.
Also, is there a way to have the Special - All in One radio button selected by default?
2. Can the Instruments live/10-second update without having to refresh the page? With the time and date alternating in the upper-left corner, I was thinking it would be live data. But the time never changes, and the data never updates on its own. My Meteobridge is set to upload to Meteoplug Cloud every 10 seconds.
TIA.
Meteoplug Cloud questions

Re: Meteoplug Cloud questions
regarding 1, it will be a different URL under the icon when you select the imperial flag. When you want the all-in-one changed you can build your own html code. This is not customizable by some user switches.
regarding 2, the dials and gauges do update automatically, you can add "&engine=js" to the URL which forces using javascript in case your flash plugin does not update data correctly.
regarding 2, the dials and gauges do update automatically, you can add "&engine=js" to the URL which forces using javascript in case your flash plugin does not update data correctly.
Re: Meteoplug Cloud questions
#1 I think you are referring to the 3 icons to the right of "Live Interval" in the Weather Network menu of Meteobridge. Those do bring up 3 live updating instruments in Imperial format. However, I was wanting the "__dashboard-1" chart to display in Imperial units: http://www.meteoplug.com/cgi-bin/meteoc ... 696a3f3137. I noticed that a few of the charts that are actually instruments have the suffix "-imp", but they are the only charts that show Imperial units. Does someone with HTML coding experience need to make a "__dashboard-1-imp" chart?
#2 It looks like the Instruments only update every 10 minutes, rather than 10 seconds as I would expect them to - with or without "&engine=js" at end of URL: http://www.meteoplug.com/cgi-bin/meteoc ... 696a3f3137 <<- That is the URL that I get when I go to the meteoplug.com Instruments menu. Strangely, the "*instruments-black-imp" chart updates every 10 seconds: http://www.meteoplug.com/cgi-bin/meteoc ... 8f80d5dfd9 - so it's not a problem with the data I'm sending.
Is there a bug in the main "Instruments" whereas it won't update in 10 sec. intervals?
Is there a restriction where the main Instruments don't update frequently if I'm within the 30-day evaluation period?
Re: Meteoplug Cloud questions
Thanks for clarification. The old fashioned WD-Live applet is only updated every 10 minutes and cannot be configured. It is more a relict from the past for hard core WD fans.
When you want frequently updated live data, go with the Saratoga templates for the Meteobridge or make use of the fusion widget based graphing inside Meteoplug used for the black live instruments.
When you want frequently updated live data, go with the Saratoga templates for the Meteobridge or make use of the fusion widget based graphing inside Meteoplug used for the black live instruments.
Re: Meteoplug Cloud questions
Thanks for answering #2. For question #1, how do I get the Meteoplug charts to display in Imperial units? In experimentation I changed the "*allinone" chart values for glunit=, but it still just gives non-imperial data as seen here: http://www.meteoplug.com/cgi-bin/meteoc ... 696a3f3137 The chart is incorrect because my temperature for example has been ranging 50-80F.
Re: Meteoplug Cloud questions
"glunit" is just changing names, without doing anything to the values.
Adapting to non ISO units can be done by specifying appropriate values for "soffset" and "sfactor" for the particular sensor. Converting from Celsius to Fahrenheit is done by sfactor#=1.8 and soffset#=32 (where # indicates the sensor number in the chart).
To convert hPa to inHg, set "sfactor" to 0.02953
Re: Meteoplug Cloud questions
Thanks. I'm almost there. I have 2 more questions - please see my updated "*allinone-imp" chart here: http://www.meteoplug.com/cgi-bin/meteoc ... 696a3f3137
1. How do I show pressure in .01 increments rather than .1?
2. Rainfall is not showing - even though I've had .20 in today so far. Please take a look at my code below so see where the omission might be.
For others learning how to convert charts from metric to imperial, here's what you need:
Temp: sfactor#=1.8 soffset#=32
Pressure: sfactor#=0.02952
Rain: sfactor#=0.0394
Wind: sfactor#=2.237
Code: Select all
timeframe=3D    # set total time frame to 3 days before today until today
zoom=MAX      # select actual day
res=min5           # get data per 5 minutes

gtitle0=Temperature
gheight0=150 gwidth0=700 glunit0=°F gtype0=line
sid0_0=th* ssmooth0_0=1 sname0_0=Temp scolor0_0=880000 sfill0_0=10 ssel0_0=temp
sfactor0_0=1.8 soffset0_0=32
sid0_1=th* ssmooth0_1=1 sname0_1=Temp_Max scolor0_1=FF0000 sline0_1=40
ssel0_1=tempmax sfactor0_1=1.8 soffset0_1=32
sid0_2=th* ssmooth0_2=1 sname0_2=Temp_Min  scolor0_2=8800FF sline0_2=40
ssel0_2=tempmin sfactor0_2=1.8 soffset0_2=32

gtitle1=Pressure
gheight1=150 gwidth1=700 glunit1=inHg gtype1=line
sid1_0=thb* ssmooth1_0=1 sname1_0=Press scolor1_0=008800 sfill1_0=10 ssel1_0=seapress
sfactor1_0=0.02952
sid1_1=thb* ssmooth1_1=1 sname1_1=Press_Max scolor1_1=00FF00 sline1_1=40
ssel1_1=seapressmax sfactor1_1=0.02952
sid1_2=thb* ssmooth1_2=1 sname1_2=Press_Min  scolor1_2=0088FF sline1_2=40
ssel1_2=seapressmin sfactor1_2=0.02952

gtitle2=Rain
gheight2=100 gwidth2=700 glunit2=in gtype2=bar
sid2_0=rain* scolor2_0=AADDFF  sfill2_0=70 sline2_0=100 sname2_0=Rain_Fall
ssel2_0=total sfactor2_0=0.0394

gtitle3=Wind
gheight3=150 gwidth3=700 glunit3=mph gtype3=line
sid3_0=wind* ssmooth3_0=1 sname3_0=Wind sfactor3_0=2.237 scolor3_0=000088
sfill3_0=10
ssel3_0=wind
sid3_1=wind* ssmooth3_1=1 sname3_1=Gust_Max sfactor3_1=2.237 scolor3_1=0000FF
sfill3_1=10 sline3_1=80 ssel3_1=gustmax Re: Meteoplug Cloud questions
it is all in the wiki...
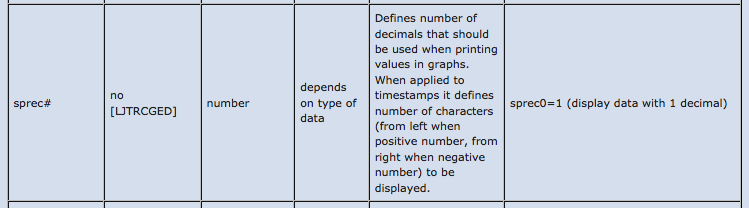
- Screen Shot 2014-05-21 at 20.50.55.png (32.03 KiB) Viewed 15120 times
Re: Meteoplug Cloud questions
Thanks. All fixed. I didn't expect to find that setting in the Sensor Settings - I was looking in Graph Settings.