Good day.
Is it possible to create a table or graph in which the number of days with max and min temperature you see?
Eg days,
max 20
max 25
max 30
max 0
max -5
0 min
minus-5
min-10
1mm rain
5mm rain
10mm rain
20mm rain
etc, etc.
Regards, Gerrit
Tabel

Re: Tabel
Hi,
that should be possible with same options that generate weibull charts for distribution of wind speed into definable buckets.
Intermixing multiple sensors into one chart/table might not be possible and buckets will nee to be "equidistant".
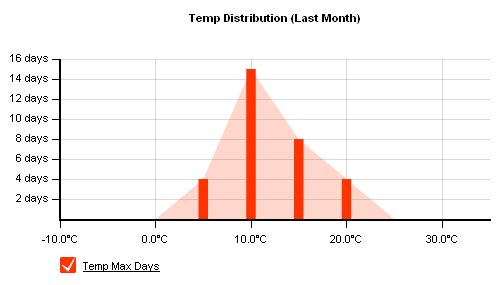
You might try this definition:
that should be possible with same options that generate weibull charts for distribution of wind speed into definable buckets.
Intermixing multiple sensors into one chart/table might not be possible and buckets will nee to be "equidistant".
You might try this definition:
Code: Select all
timeframe=-1M    # set total time frame to last month
res=day1

gtitle=Temp_Distribution_(Last_Month)    # name of graph
gheight=300                   # height in pixels of graph
gwidth=550                    # width in pixels of graph
gtype=bar                    # type of graph
glunit=_days                       # unit of y-axis
grunit=%.1f°C              # format string for x-axis data
xymode=10                   # set xy-mode and define 40 iterations
xstart=-10.0                       # start value for x-axis
xinc=5.0                        # increment
gcolwidth=20                # width of bars
gtrim=0                    # don't skip buckets with zero count

sid0=th0 sunit0= sname0=Temp_Max_Days ssel0=tempmax sprec0=1 sfill0=20- Attachments
-
- Noname.png (5.49 KiB) Viewed 7748 times
Re: Tabel
If you want to display how distribution of temp into the buckets you have defined changes from month to month the predefined chart "_tempdays-1year" might be worth a look. Here buckets don't need to be equidistant and you might be able to have multiple sensors in one chart.
Lots of options to change from
Lots of options to change from
-
skyewright
- Posts: 69
- Joined: Tue Mar 16, 2010 12:05 pm
- Location: Isle of Skye
- Contact:
Re: Tabel
I think that level of interaction is simply not a feature of the type of chart used for these 'weibull' charts?Gerrit wrote:This is what I want, I just do not get a date range, such as 1D 10D 1M 1Y MAX.
David
Re: Tabel
Yes, weibull charts don't have time frame on x-axis. Therefore, amstock-charts cannot be used, I have to go with amline-charts, which allow for any x-axis values. As a consequence, you don't have a time scaling option build in.
-
skyewright
- Posts: 69
- Joined: Tue Mar 16, 2010 12:05 pm
- Location: Isle of Skye
- Contact:
Re: Tabel
I may have misunderstood, but if you want to see the same sort of thing but for a whole year you can achieve that by chaninging the timeframe.Gerrit wrote:Hello.
I would have liked to seen the difference a year now I can see an overview.
Is that not another way possible?
e.g. if you change
timeframe=-1M # set total time frame to last month
to
timeframe=20090101000000-20100101000000 # set total time frame to be the year 2009
it gives a distribution for 2009.
As I reported in this topic if the number of data values (i.e. the number of res in timeframe) exceeds some value the graph starts getting odd, but with res=day1 then plotting for a year (i.e. 365 data values) is no trouble at all.
Of course, it may be that you wanted something different to what I'm describing?
David
Re: Tabel
Hello.
I've now done as follows for each year a new graphics made me understand that it is not in a can?
http://www.natuurrondleidingen.nl/weers ... atuur.html
I have the min and max in the max around downwards that is fine.
the more I would like to see rounded upwards, is that possible?
Regards, Gerrit
I've now done as follows for each year a new graphics made me understand that it is not in a can?
http://www.natuurrondleidingen.nl/weers ... atuur.html
I have the min and max in the max around downwards that is fine.
the more I would like to see rounded upwards, is that possible?
Regards, Gerrit
-
skyewright
- Posts: 69
- Joined: Tue Mar 16, 2010 12:05 pm
- Location: Isle of Skye
- Contact:
Re: Tabel
I like that. Well done.Gerrit wrote:I've now done as follows for each year a new graphics made me understand that it is not in a can?
http://www.natuurrondleidingen.nl/weers ... atuur.html
David