Page 1 of 1

A couple of CC128 Energy Monitor graph/table definitions

Posted: Thu Apr 01, 2010 5:40 pm
by skyewright
People with a Cost Control CC128 Energy Monitor might be interested in a couple of definitions that I've been using.

Meteoplug records CC128 data as watt values. Both definitions combine use of average watts across a certain 'time bucket' with a factor to convert the value into an equivalent kWh figure, e.g. (average watts over an hour) * 0.001 gives the kWh for the hour, and (average watts over a day) * 0.024 gives the kWh for the day.

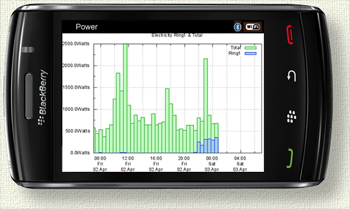
The first definition is an Interactive chart showing the kWh usage for each hour across a week (with default zoom view of a single day).

The second definition produces a table showing the overall daily kWh usage for each of the last 7 days. N.B. The table makes used of the daily average value, so the figures for "today" is only an estimate of the whole day's usage based on the day so far.

Code: Select all

timeframe=168H # 1 week as hours
res=hour1
zoom=1D            # select actual day 

gtitle=Electricity        # name of graph
gheight=400       # height in pixels of graph
gwidth=550         # width in pixels of graph
glunit=kWh         # unit of left y-axis
gtype=bar           # type of graph
gtrim=0              


sid0=data16 sname0=Stg ssel0=val sfactor0=0.001 scolor0=FF0000
sid1=data18 sname1=24Hr ssel1=val sfactor1=0.001 scolor1=009900
sid2=data17 sname2=Water ssel2=val sfactor2=0.001 scolor2=0000FF
sid3=data11 sname3=Dom ssel3=val sfactor3=0.001 scolor3=9900FF

Code: Select all

timeframe=7D
res=day1
zoom=7D

gtitle=Electricity        # name of graph
gheight=400       # height in pixels of graph
gwidth=550         # width in pixels of graph
gtype=table                    # type of graph
glunit=Date
grunit=%F
gtrim=0              
gtablestyle=style="border:1px_#000000_solid"
gtdheadstyle=style="border:1px_#000000_solid"
gtdstyle=style="border:1px_#000000_solid"


sid0=data16 sname0=Stg ssel0=val sfactor0=0.024 scolor0=FF0000
sid1=data17 sname1=Water ssel1=val sfactor1=0.024 scolor1=0000FF
sid2=data18 sname2=24Hr ssel2=val sfactor2=0.024 scolor2=009900
sid3=data11 sname3=Dom ssel3=val sfactor3=0.024 scolor3=9900FF

Re: A couple of CC128 Energy Monitor graph/table definitions

Posted: Thu Apr 01, 2010 6:20 pm
by oliverb
Thanks for the charts. They work great. I have used sensors data0 and data1.

What current cost set up do you have? Do you have individual appliance sensors or clamp meter type or maybe something else?
Brett.

Re: A couple of CC128 Energy Monitor graph/table definitions

Posted: Fri Apr 02, 2010 10:05 am
by skyewright
oliverb wrote:What current cost set up do you have? Do you have individual appliance sensors or clamp meter type or maybe something else?
I have 2 of the 'standard' transmitters, and on each of those I also have 2 extra 12mm clamps plugged in to the other sockets on the transmitters. That works out okay for me as we use the "Total Control" tariff, so at the distribution board I can clip onto domestic, storage, water and "on demand heating" wires. That leaves the two hard wired 27mm clamps effectively spare, so I have those on "all the cheap rate" and "all electricity" wires just for comparison.

Re: A couple of CC128 Energy Monitor graph/table definitions

Posted: Sat Apr 03, 2010 5:47 am
by oliverb
I have played around with your graph definitions and knocked up a web page so I can keep an eye on my power from my Blackberry.
My Blackberry does not work with Flash as yet so I set the graph type to GPxxx . I have made a link page with a number of buttons to generate a graph from Meteoplug.
Buttons linked to Meteoplug graph definitions
Black1.jpg (56.43 KiB) Viewed 14249 times
This shows the advantage of Meteoplug over my Meteohub system where I have to set-up a graph and upload it or rely on access to my Meteohub live via dyndns.
Either way this is a saving in traffic over my slow home connection.
Meteoplug generated graph on my mobile
Black2.jpg (47.14 KiB) Viewed 14249 times

Thanks again for uploading the definitions I find it so much easier to work from working examples.
Brett.
edit bad spelling

Re: A couple of CC128 Energy Monitor graph/table definitions

Posted: Sun Apr 04, 2010 6:20 pm
by admin
Thanks for sharing this application example. The graph looks very cool inside a blackberry.

Re: A couple of CC128 Energy Monitor graph/table definitions

Posted: Thu Apr 22, 2010 8:37 pm
by gibsonmb
Guess I must be thick, where do I specify in these examples the sensors that are providing the data, my total cc128 power figure is reported on sensor ID 'data0' for the red phase which supplies most of the house. 'data1' and 'data2' are the blue and yellow phases which ony come into play when I run three phase machines in the workshop. 'data3' is a subset of 'data0' for the office only. For now I'd like to test the graphs just using 'data0' as the sensor?


Got it now.... data 16-18...... change to data0-3 in my case

Re: A couple of CC128 Energy Monitor graph/table definitions

Posted: Fri Apr 23, 2010 9:10 am
by skyewright
gibsonmb wrote:Got it now.... data 16-18...... change to data0-3 in my case
Yes, that sounds very likely. My choice of 16-18 as the data numbers is probably a bit idiosyncratic. ;)

The clues are the "s" and "ch" numbers on the Sensors page in Meteoplug. e.g.

Code: Select all

s0:ch1:power	0
refers to Channel 1 on Sensor0.

The terminology may take a bit of getting used to (i.e. what CC call a "Sensor" is what I think of as a "Transmitter" and what CC call a "Channel" is what I think of as a "Sensor"), but that's how CC decided to do it so that's how it is. :)

Re: A couple of CC128 Energy Monitor graph/table definitions

Posted: Sat Jun 04, 2011 8:21 pm
by oliverb
I have been playing around with a Current Cost Analogue Development Board £5.00 from ebay http://cgi.ebay.co.uk/Current-Cost-Anal ... 27ba699044 and am attempting to use it via meteohub to record my gas usage.

I now have a working sensor that detects every 0.01cu M of gas. The sensor then pulses the Current Cost Analogue Development Board which outputs direct to my CC128 energy monitor and meteohub.

I will use skyewrights graph definitions to display my gas usage once I have got my head around the conversions.

Note the sensor I use does not inter-fear with the gas meter in anyway and uses the magnetic pulse from the meter to drive a Hall Effect transistor.

If anyone is interested I can post some diagrams of the sensor.

Re: A couple of CC128 Energy Monitor graph/table definitions

Posted: Sun Jun 05, 2011 12:36 pm
by skyewright
oliverb wrote:If anyone is interested I can post some diagrams of the sensor.
Sounds good.

I've no use for it myself, but I know someone else who might be interested. He's not a Meteoplug user yet, but maybe this might be enough to whet his appetite? :)