
As you might have noticed, Meteoplug can receive live data of your sensors in intervals down to 10 seconds since a week or two. Simply select that option on "Settings" page and you are done. Your Meteoplug client will need a reboot to load the new code as well.
My working on special kinds of charts that can display live data did produce a prototype I would like to post here for comments and ideas from your side. This prototype does a "regular" chart definition as you use them for the other charting options of Meteoplug. The prototype is named "_live-demo-black". Feeld free to select it from the drop-down list of available charts. As you see, the elements of the chart are separately defined as widgets with sensor definitions in the classical meteoplug style and an additional property section between the <chart> tags, which is filled by definitions in fusionchart style. Documentation how this all works in detail will follow. Defined widgets are composed by regular CSS statements on the screen to make up a dash board. As you see this is extremely flexible and when you get familar to the fusionchart parameters you can make very individual live data charting.
Best thing here is, that you don't have to buy these widgets from fusioncharts. As with amcharts, Smartbedded did purchase a SaaS license for usage in Meteoplug. To keep costs at a reasonable level smartbedded and fusioncharts agreed on the small fusionchart advertisement sticker in the bottom left corner. Please dont try to remove this, it would break the T&Cs of using that feature.
I hope you enjoy the new features and like the way powerful graphing tools are included step by step into the Meteoplug concept (amcharts from start on, now fusion widgets).
This is a link to live display of my remote station and screen shot how the live chart does look like:
Prototype for Dashboard with live data
Prototype for Dashboard with live data
- Attachments
-
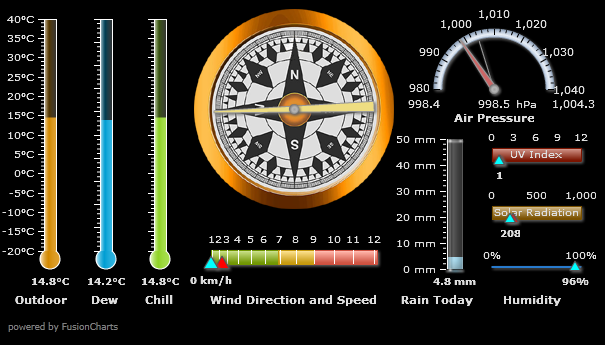
- Unbenannt.PNG (93.63 KiB) Viewed 20627 times
Re: Prototype for Dashboard with live data
Please be aware that the graphical elements in the dash board do not support zooming. Therefore zooming the window will misplace the meters and gauges.
Re: Prototype for Dashboard with live data
I tried to implement it, but I´m getting no values at all 
http://www.meteoplug.com/cgi-bin/meteoc ... f5eaf6f8fe
Do I have to wait for recomputation after upgrading to 4.8a to be finished?
BTW: I did a reboot of my meteohub after changing to 10 seconds livedaten
.
Why does the Livedaten-Intervall with meteoplugs GUI say "kein" ??


http://www.meteoplug.com/cgi-bin/meteoc ... f5eaf6f8fe
Do I have to wait for recomputation after upgrading to 4.8a to be finished?
BTW: I did a reboot of my meteohub after changing to 10 seconds livedaten
.
Why does the Livedaten-Intervall with meteoplugs GUI say "kein" ??
Re: Prototype for Dashboard with live data
When you change settings on the meteohub it will take until the next regular upload to Meteoplug is done to make changes applied to Meteoplug.
I would expect the Meteoplug display to change to the recent value auf 10 minutes or so.
Does the problem still occur?
I would expect the Meteoplug display to change to the recent value auf 10 minutes or so.
Does the problem still occur?
Re: Prototype for Dashboard with live data
Live data display is still quite experimental. I did some changes to how the flash instruments do poll data from the server, which result into a much lower server load. Please expect this feature still being not completely reliable until I get out of testing.
Re: Prototype for Dashboard with live data
Could you please mail me your Meteoplug account name? I would like to check a few things.wfpost wrote:I tried to implement it, but I´m getting no values at all
http://www.meteoplug.com/cgi-bin/meteoc ... f5eaf6f8fe
Re: Prototype for Dashboard with live data
I did some more work on the live display. A first documentation how to use it can now be found in the wiki. While not completely easy to understand by a Meteoplug newby, I hope the users with some Meteoplug graphing experience will be able to work with it.
Link: http://wiki.meteoplug.com/Define_Chart#Display_Language
Link: http://wiki.meteoplug.com/Define_Chart#Display_Language
Re: Prototype for Dashboard with live data
I'm using the dashboard with white background which is also very nice.
I have a question about the rain gauge: can the max value of 50 be made variable?
So starting max of 10 mm. and growing with the amount of rainfall?
I have a question about the rain gauge: can the max value of 50 be made variable?
So starting max of 10 mm. and growing with the amount of rainfall?
- Attachments
-
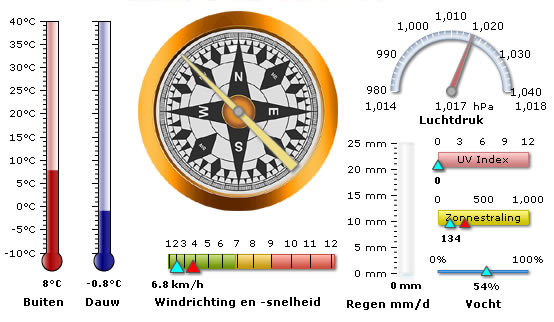
- Dashboard with white backround.
- livedashboard.jpg (48.76 KiB) Viewed 19976 times
Re: Prototype for Dashboard with live data
As the min/max values are given as a static string in the chart definition there is no option to make it dependent on weather data. I could think about introducing template variables into that part and punching weather data into that string before sending it to the flash applet. But this will make things even more sophisticated as they are right now 
Any more votes for this?
Any more votes for this?