Hi,
graph "instruments" displays pressure on station altitude but shows a description which says it's pressure on sea level.
Both pressure values are reported to meteoplug as you can see below. Can I correct this? I changed my client from meteoplug to meteobridge; could this be the reason?
Kind regards, Thomas
graph "instruments" displays pressure on station altitude
Re: graph "instruments" displays pressure on station altitude
Hi,
I did some further testing with other graphs and it seems the following statements are correct:
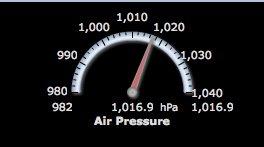
- seapressure is correct if displayed as live data (1016.9hPa) s. below:
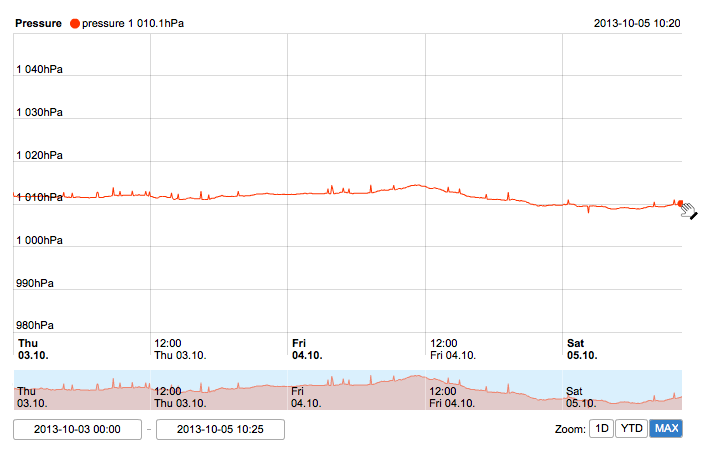
- all other graphs which reports on seapress shows a value about 7 hPa below the actual seapress (at the moment 1010.1):
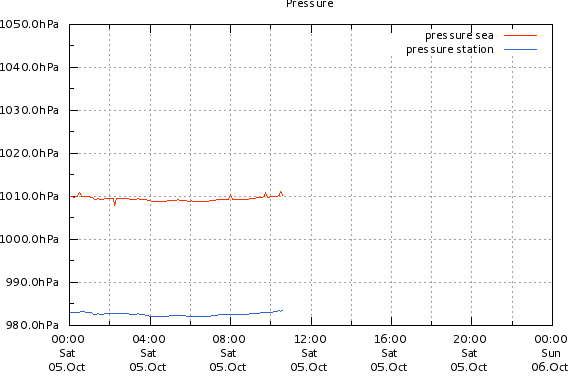
- pressure on station altitude as expected (983.4 hPa):
- the raw data of seapress is exported as expected (1016.9 hPa).
Find below the data reported on "inspect data":
2013-10-05 10:27:03 thb0 22.6°C 58% 13.9°C 983.3hPa 1016.8hPa
2013-10-05 10:27:03 wind0 168° 0.0m/s 0.0m/s 16.7°C
2013-10-05 10:27:05 wind0 169° 0.0m/s 0.0m/s 16.7°C
2013-10-05 10:27:07 wind0 168° 0.0m/s 0.0m/s 16.7°C
2013-10-05 10:27:11 wind0 169° 0.0m/s 0.0m/s 16.7°C
2013-10-05 10:27:21 wind0 168° 0.0m/s 0.0m/s 16.7°C
2013-10-05 10:27:23 wind0 169° 0.0m/s 0.0m/s 16.7°C
2013-10-05 10:27:31 wind0 168° 0.0m/s 0.0m/s 16.7°C
2013-10-05 10:27:33 rain0 0.0mm/h 706.0mm
2013-10-05 10:27:41 wind0 169° 0.0m/s 0.0m/s 16.7°C
2013-10-05 10:27:47 th0 16.7°C 97% 16.2°C
2013-10-05 10:27:59 wind0 168° 0.0m/s 0.0m/s 16.7°C
2013-10-05 10:28:01 wind0 169° 0.0m/s 0.0m/s 16.7°C
2013-10-05 10:28:03 thb0 22.6°C 58% 13.9°C 983.4hPa 1016.9hPa
2013-10-05 10:28:09 wind0 168° 0.0m/s 0.0m/s 16.7°C
2013-10-05 10:28:11 wind0 169° 0.0m/s 0.0m/s 16.7°C
2013-10-05 10:28:15 wind0 169° 0.4m/s 0.0m/s 16.7°C
2013-10-05 10:28:23 wind0 166° 0.4m/s 0.0m/s 16.7°C
2013-10-05 10:28:25 wind0 165° 0.9m/s 0.0m/s 16.7°C
2013-10-05 10:28:29 wind0 165° 0.4m/s 0.0m/s 16.7°C
2013-10-05 10:28:33 wind0 164° 0.9m/s 0.0m/s 16.7°C
2013-10-05 10:28:35 rain0 0.0mm/h 706.0mm
2013-10-05 10:28:35 wind0 165° 0.9m/s 0.0m/s 16.7°C
2013-10-05 10:28:45 wind0 165° 0.4m/s 0.0m/s 16.7°C
2013-10-05 10:28:49 th0 16.7°C 97% 16.2°C
2013-10-05 10:28:55 wind0 167° 0.4m/s 0.0m/s 16.7°C
2013-10-05 10:28:57 wind0 167° 0.0m/s 0.0m/s 16.7°C
2013-10-05 10:29:05 thb0 22.6°C 58% 13.9°C 983.4hPa 1016.9hPa
*** end of data ***
Thanks for any hint what could be the cause of my problem.
Thomas
Re: graph "instruments" displays pressure on station altitude
Because I don't get any reply, I'm asking myselfe, if this may be a silly question. Is there someone who can just judge, if this is some kind of a stupid question? My intention is to plot the actual seapress over time, not an average or something like that.
Re: graph "instruments" displays pressure on station altitude
Meteoplug provides different sensor selectors for receiving station pressure or sealevel corrected pressure.
The graphs do show this a way which looks consistent to me. As sea level corrected pressure is the one we are usually dealig with,
the live display is using this for display, but this can be changed in the definition of the dashboard if someone likes to do so.
Please make a screen dump of your weather statin page in Meteoplug, because there you define how
to compute sea level, which also depends on the station your are using. So we need more detail to understand
why raw data does differ from line graphs... if this is the thing that is puzzling you.
Do you have sensor calibrations applied? If so please also make a screendump of those, too.
Do your feed with a meteohub or with a meteoplug client?
Re: graph "instruments" displays pressure on station altitude
I feed the data of my vantage vue with a meteobridge client and I don't have any sensor calibrations applied. Please keep in mind, that I changed my client from meteoplug to meteobridge, as I wrote in my first post. Find below the following screen dumps.
meteobridge client "Wetterstation": meteoplug client "Einstellungen": meteoplug "Instrumente": Please tell me, if a screen dump is missing.
meteobridge client "Wetterstation": meteoplug client "Einstellungen": meteoplug "Instrumente": Please tell me, if a screen dump is missing.
Re: graph "instruments" displays pressure on station altitude
My last update with the requested screen dumps was about 4 weeks ago. Could you please judge the situation or tell me what information is still missing. Thanks a lot.
Re: graph "instruments" displays pressure on station altitude
I just found some spare time to dig into this problem. Root cause is the the Meteobridge upload function to Meteoplug did not transfer station altitude correctly. This has now been fixed with the very last Meteobridge update (just released today). Please reboot the Meteobridge, wait 15 minutes, then login to your Meteoplug account, goto page "inspect data" and issue a complete data recomputation. Operation can take a few hours. When head line no longer tells about a recomputation scheduled or running, changes are applied to all your data and graphs should look fine again.


